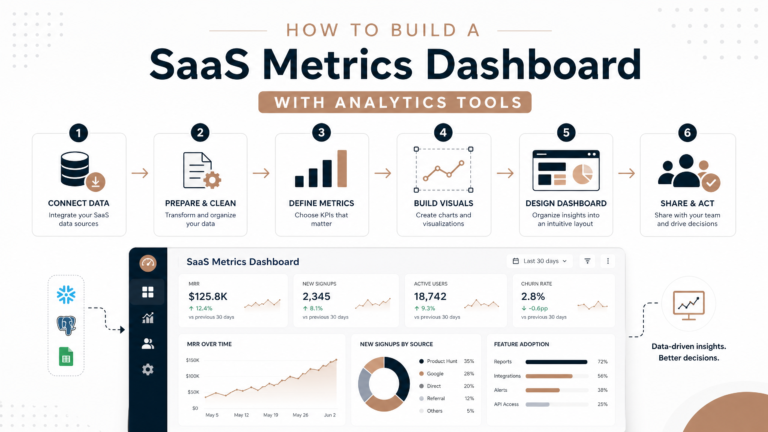
Tableau vs. Power BI: Data Visualization Tools for Business Intelligence
In the rapidly evolving landscape of business intelligence (BI), data visualization tools are essential for transforming raw data into actionable insights. Tableau and Power BI are two leading platforms, each offering robust capabilities for data analysis, dashboard creation, and report generation. While both are powerful, they cater to different user bases and excel in distinct areas. This article provides a comprehensive comparison of Tableau and Power BI, examining their features, strengths, weaknesses, and ideal use cases to help businesses make an informed decision.
Tableau Overview
Tableau, a visual analytics platform now part of Salesforce, is a leader in data visualization. Founded in 2003, its mission is to help people understand data through intuitive, interactive visualizations. Tableau is known for simplifying complex data analysis for a wide range of users, from data analysts to business executives [1] [2].
Key Features and Functionalities of Tableau
- Visual Analytics Platform: Transforms complex datasets into interactive and visually appealing dashboards and reports, enabling quick insight discovery [1] [3].
- Drag-and-Drop Interface: Intuitive interface allows users to create sophisticated charts and visualizations without extensive coding, promoting self-service analytics [2] [4].
- Extensive Data Connectivity: Offers robust connectivity to over 75 data sources, including databases, spreadsheets, cloud services, and web data connectors [3] [4].
- Product Suite: Includes Tableau Desktop for analysis, Tableau Cloud for hosted BI, Tableau Server for on-premises deployment, and Tableau Prep Builder for data preparation [2].
- In-Memory Engine: Designed for efficient handling and analysis of large datasets, processing millions of rows with high performance [3].
Strengths of Tableau
- Superior Data Visualization: Recognized for best-in-class visualization, offering an extensive chart library, granular customization, and highly interactive dashboards for deep data exploration [3] [4].
- User-Friendly Interface: Intuitive design and drag-and-drop functionality make it easy for non-technical users to create compelling visuals and perform analyses [4].
- Strong Data Integration: Supports diverse data types and provides powerful features for blending and joining data from disparate sources [4].
- Advanced Analytics: Integrates effectively with advanced analytical and statistical tools for predictive modeling and trend identification [4].
- Geographical Visualization: Excellent for visualizing spatial data, enabling precise geographical analyses and multi-layered maps [4].
- Scalability: Built to handle large and complex datasets for organizations of all sizes [4].
- Vibrant Community and Support: Large and active user community with extensive online resources, forums, and user groups [3] [4].
Weaknesses of Tableau
- High Cost: Generally more expensive, with per-user licensing potentially limiting small to medium-sized businesses [3] [4].
- Limited Data Preparation: Core visualization tool has limitations in data preparation, often requiring external tools for cleaning and transformation [4].
- Customization Challenges: Visual customization can be less flexible for highly complex datasets or unconventional representations [4].
- Lack of Native Scheduling: No built-in scheduling for reports, necessitating manual updates or third-party solutions [4].
- Version Control Issues: Lacks robust native version control, complicating change tracking and modification management in collaborative projects [4].
- Siloed Collaboration: While Tableau Server offers some online collaboration, it can be less effective for real-time co-working and iterative development [2] [4].
Power BI Overview
Microsoft Power BI is a comprehensive business analytics platform that helps organizations connect, visualize, and share data effectively. As a core component of Microsoft Fabric, Power BI leverages the broader Microsoft ecosystem for powerful analytics. It is widely used for creating interactive dashboards and reports that transform raw data into meaningful insights for business users, report creators, and developers [5].
Key Features and Functionalities of Power BI
- Business Analytics Platform: Converts raw data into interactive dashboards and reports for business intelligence [5] [7].
- Deep Microsoft Integration: Seamlessly integrates with Microsoft products like Excel, Azure, Microsoft 365, and Teams, providing a cohesive analytical environment [5] [6] [7].
- Power BI Desktop: Windows-based application for data modeling, report creation, and advanced transformations [5].
- Power BI Service: Cloud-based platform for publishing, sharing, and collaborating on reports and dashboards [5].
- Extensive Data Connectivity: Supports connections to over 100 data sources, including databases, cloud services, files, and web sources [5].
- Power Query Editor: Integrated tool for data transformation, cleaning, and shaping without coding [5].
- DAX (Data Analysis Expressions): Powerful formula language for complex data models, calculated columns, and measures [5].
- AI-Enhanced Analytics: Incorporates AI features like predictive analytics, anomaly detection, automated insight generation, and Copilot for natural language queries [7].
Strengths of Power BI
- Cost-Effectiveness: Offers a free desktop version and competitive pricing for Pro and Premium plans, making it attractive for businesses seeking powerful BI without high investment [6] [7].
- Seamless Microsoft Ecosystem Integration: Deep integration with Microsoft 365, Azure, and other Microsoft services provides efficient workflows for Microsoft-invested organizations [6] [7].
- User-Friendly for Business Users: Drag-and-drop interface allows non-technical users to create dashboards and explore data easily, especially for basic reporting [6] [7].
- Advanced Data Analytics Capabilities: Extensive features for complex data analysis, including the powerful DAX language for intricate calculations and data modeling [6].
- Rich Visualizations and Community: Wide range of visualization options, custom visuals, and a large, active global community [7].
- Real-Time Data Refresh: Supports direct connections to data sources for live data refreshing and up-to-date reporting [6].
- AI-Powered Insights: Features like Copilot and Q&A enhance data exploration with natural language questions and AI-generated insights [7].
- Scalability for Big Data: Capable of processing and analyzing large volumes of data, suitable for big data analytics [6].
Weaknesses of Power BI
- Steep Learning Curve for Advanced Features: Mastering DAX and advanced data modeling can be challenging and requires significant learning [6] [7].
- Microsoft-Centric Limitations: Desktop application is Windows-only; some sharing and authentication processes tied to Azure Active Directory, limiting Mac users or mixed tech environments [7].
- Limited NoSQL and API Support: Excels with SQL databases but struggles with native integration for NoSQL databases and REST APIs, often requiring custom connectors or ETL [7].
- On-Premises Feature Parity: Power BI Report Server (on-premises) lacks full feature parity with the cloud-based Service, limiting options for strict data residency [7].
- Interface Overload: Power BI Desktop interface can be overwhelming for new users due combining data preparation, modeling, and visual design [7].
- Collaboration Limitations: Real-time collaborative editing on reports and dashboards can be limited compared to other platforms [6].
- AI Feature Cost: Advanced AI capabilities like Copilot are often locked behind Premium licensing, increasing overall cost [7].
Head-to-Head Comparison: Tableau vs. Power BI
Let’s compare Tableau and Power BI across several critical dimensions:
| Feature | Tableau | Power BI |
|---|---|---|
| Ease of Use/Learning Curve | Highly intuitive drag-and-drop for basic visualizations. Advanced features require learning. | User-friendly for basic tasks, especially for Excel users. DAX for advanced modeling has a steeper learning curve. |
| Data Connectivity | Extensive native connectors (75+), strong performance with diverse data sources. | Broad connectivity (100+), strong with Microsoft ecosystem. Can struggle with native NoSQL/API. |
| Visualization Capabilities | Industry-leading visual appeal, extensive chart library, highly customizable and interactive dashboards. | Rich visualization options, good customization, strong for standard business reporting. |
| Performance and Scalability | Robust in-memory engine handles large datasets efficiently, suitable for enterprise-level deployments. | Scalable for big data analytics, especially within Azure. Performance can vary with complex models. |
| Pricing Models | Generally higher cost; per-user licensing can be expensive for large teams. | More cost-effective; free desktop version, competitive Pro/Premium plans. |
| Integration and Ecosystem | Integrates well with various data sources and Salesforce ecosystem. | Deep integration with Microsoft 365, Azure, Excel, Teams. Less native support for non-Microsoft tools. |
| Community and Support | Very active and supportive global community, extensive online resources. | Large community, extensive Microsoft documentation, frequent updates. |
| AI and Advanced Analytics | Integrates with advanced statistical tools, some machine learning capabilities. | Strong AI features like Copilot, Q&A, predictive analytics, though some are Premium-only. |
| Deployment Options | Cloud (Tableau Cloud), Server (on-premises), Desktop. More flexible on-premises options. | Cloud (Power BI Service), Desktop (Windows-only), Report Server (on-premises, limited features). |
Use Cases and Ideal Scenarios
When to Choose Tableau
Tableau is preferred for organizations prioritizing advanced, highly interactive, and aesthetically pleasing data visualizations. It is well-suited for:
- Data Analysts and Scientists: For deep exploratory data analysis and sophisticated visual storytelling.
- Diverse Data Sources: Businesses needing to connect to a wide variety of non-Microsoft data sources and perform complex data blending.
- Visual Storytelling: Users creating compelling, interactive dashboards to communicate insights effectively.
- Self-Service BI: Environments empowering business users to create their own reports with minimal IT intervention.
- Mac Users: Tableau Desktop is available for both Windows and Mac, offering better compatibility for Mac-centric teams.
When to Choose Power BI
Power BI excels in environments deeply integrated with the Microsoft ecosystem and for organizations seeking a cost-effective yet powerful BI solution. It is an excellent fit for:
- Microsoft-Centric Organizations: Businesses heavily utilizing Microsoft 365, Azure, Excel, and other Microsoft products will find Power BI’s integration seamless.
- Budget-Conscious Teams: Companies seeking a robust BI tool with a free desktop version and affordable subscription plans.
- Business Users and Executives: Individuals needing quick access to standard reports, KPIs, and dashboards with user-friendly interfaces, often leveraging AI-powered Q&A.
- Large-Scale Data Warehousing on Azure: Organizations with data infrastructure primarily on Azure will benefit from Power BI’s optimized performance and scalability.
- Predictive and AI-Driven Analytics: Teams leveraging built-in AI capabilities for predictive modeling, anomaly detection, and automated insights, especially with Premium features.
Conclusion
Both Tableau and Power BI are formidable players in business intelligence. Tableau stands out for its unparalleled data visualization, intuitive interface, and strong support for diverse data sources, making it ideal for visual storytelling and deep exploratory analysis. However, its higher cost and some limitations in data preparation and collaboration are considerations.
Power BI offers a cost-effective solution with deep integration into the Microsoft ecosystem, making it ideal for businesses already invested in Microsoft technologies. Its user-friendly interface for basic tasks, robust advanced analytics with DAX, and growing AI capabilities provide significant value. However, its Windows-only desktop application and less native support for non-Microsoft data sources can be limiting.
Ultimately, the choice between Tableau and Power BI depends on an organization’s specific needs, existing technology stack, budget, and user proficiency. If visual aesthetics and advanced exploratory analysis are paramount, and budget is less of a constraint, Tableau might be superior. Conversely, if seamless integration with Microsoft products, cost-effectiveness, and a strong focus on standard business reporting and AI-driven insights are key, Power BI is a compelling option.
We encourage you to explore both tools through their free trials or demos to determine which platform best aligns with your business intelligence strategy. For more in-depth reviews and comparisons of leading SaaS data analytics tools, visit SaaSSync Pro.
References
- What is Tableau? – Tableau
- What is Tableau & What is it Used For? An Analyst’s Guide – Mode
- The pros and cons of Tableau: What you should know in 2026 – ThoughtSpot
- Advantages and Disadvantages of Tableau: Detailed Explanation – The Knowledge Academy
- What is Power BI? – Power BI – Microsoft Learn
- Advantages and Disadvantages of Power BI – GeeksforGeeks
- Power BI Review 2026: Strengths, Limitations & Alternatives – Knowi